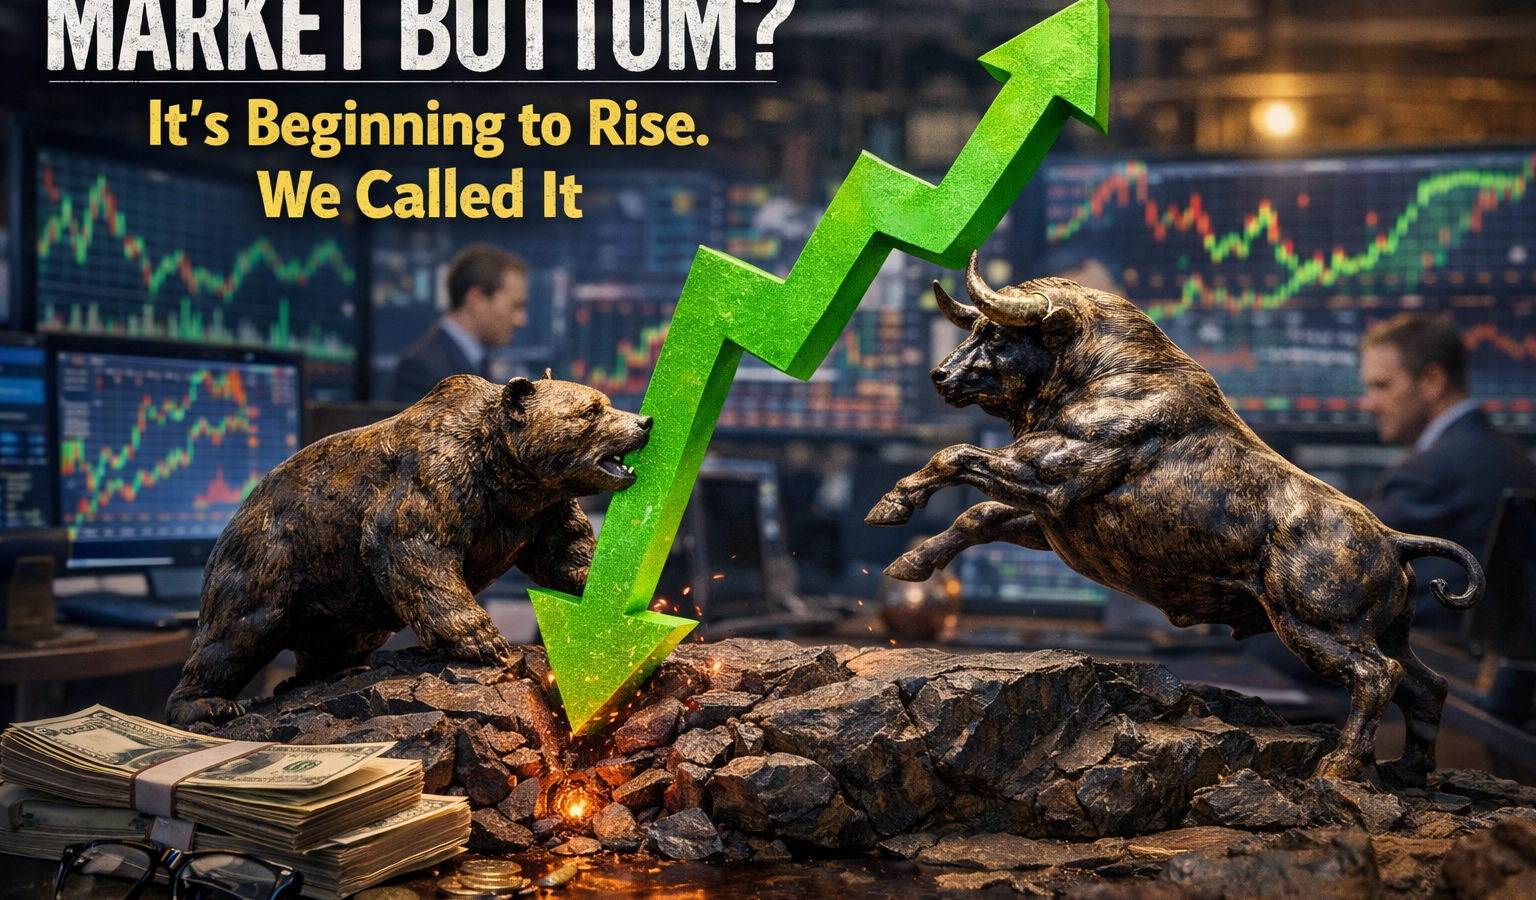
We Called The Market Was Bottoming
Question? Can It Hold?
THE ROTATION IS ON
Gold, the Ceasefire Rally, and Why Money Is Flooding Back Into the Mag 7
Gold Is Telling You Something
Before we get into the tape, the technicals, and the sector rotation that’s reshaping this market — let’s talk about the one asset that’s been screaming the truth for months: gold.
Gold closed the week at $4,787 per ounce. Let that number sink in. We’re knocking on the door of $5,000, and the reasons are not complicated. I see three forces pushing gold higher, and none of them are going away anytime soon.
First, the dollar is weakening — and it’s going to keep weakening in 2026. The trade war, the tariff regime, the deficit spending — all of it is structural pressure on the greenback. When the world’s reserve currency loses purchasing power, capital flows into the one asset that has been money for five thousand years. Central banks know this. They’ve been the biggest buyers of gold for three consecutive years, and they’re not stopping. The dollar weakness story is not a trade — it’s a trend.
Second, hedging. We just lived through a five-week shooting war with Iran that closed the Strait of Hormuz and sent oil above $110. Even with the two-week ceasefire announced on April 8, nobody with real money is taking the geopolitical risk off the table. A two-week pause is not a peace deal. Gold at $4,787 tells you that institutional portfolios are maintaining their hedges because the risk of escalation has not been eliminated — it’s been paused.
Third, risk management at the portfolio level. When you have the S&P 500 trading at 22x forward earnings, the Mag 7 representing 32.5% of the index, a Fed that can’t decide whether to cut or hike, and a tariff regime that’s now a permanent feature of the landscape — gold is the only asset that doesn’t care about any of it. It’s uncorrelated insurance. The fact that gold is holding near all-time highs while equities are rallying is actually a rare signal. It means smart money is positioned for both outcomes: the rally continuing, and the rally failing. That’s not bearish. That’s professional.
Gold is doing exactly what it’s supposed to do in this environment. Respect it. Now let’s get into the equity tape.
The Index: S&P 500 Price Action — March 30 to April 12
The S&P 500 closed at approximately 6,320 on March 30 after a brutal late-March selldown driven by the Iran conflict and the oil shock. By Friday April 10, the index had rallied to 6,816.89 — a gain of roughly 490 points, or 7.9%, in less than two weeks. That is one of the most powerful short-term rallies we’ve seen since the April 2025 tariff-pause rip.
The catalyst was the April 8 ceasefire rally. When Trump announced the two-week suspension of attacks on Iran, the Dow ripped 1,325 points higher, the S&P popped 2.51%, and the Nasdaq surged 2.80%. WTI crude collapsed more than 16% in a single session to $94.41 per barrel — its biggest single-day drop since April 2020. That oil collapse rewired the entire inflation narrative overnight.
The 200-day moving average on the S&P sits around 6,600 and was the line in the sand. The index cleared it and is now trading comfortably above — which is constructive, but not yet confirmed as a breakout. Support sits at 6,700. Resistance is at 6,900, which is the gateway to retesting the year-to-date high near 6,978. The RSI on the index is in neutral territory — neither overbought nor oversold — which leaves room for further upside if catalysts support it.
The Internals Don’t Lie — Breadth Indicators
This is where we separate the professionals from the amateurs. Price is what everyone sees. Breadth is what the market is actually doing.
Stocks Above the 200-Day Moving Average
The $S5TH indicator — the percentage of S&P 500 companies trading above their 200-day moving average — sits at 57.65% as of April 10. That’s roughly 288 out of 500 companies. For context, the 52-week low on this reading was a devastating 15.10% back on April 9, 2025 during the tariff panic bottom, and the 52-week high was 68.58%. We’re in the middle-upper range — healthy, but not euphoric.
On March 30, during the depth of the Iran selloff, this number had pulled back from the mid-60s into the mid-to-upper 50s. The improvement to 57.65% confirms the rally has breadth participation, but it’s not a powerful thrust. We need to see this push toward 65%+ to confirm a sustainable new upleg.
Stocks Above the 50-Day Moving Average — The Yellow Flag
This is the weaker signal and the one I’m watching most closely. As of April 11, only 43% of S&P 500 stocks are above their 50-day moving average. While 66% are above their 20-day (short-term strength) and 59% are above their 5-day, the 50-day reading at 43% tells you the medium-term trend is still damaged. On March 30, this number was likely in the low 30s given the severity of the selloff. So it’s improved meaningfully — but 43% is still below the 50% threshold that separates bullish from bearish territory on a medium-term basis.
What this means: The rally is real, but the internals are showing a market that has bounced hard off a fear-driven low without yet achieving the kind of broad-based participation that confirms a new upleg. The 200-day breadth at 57.65% is healthy. The 50-day breadth at 43% is a yellow flag. You need the 50-day reading to cross above 50% to confirm the move.
McClellan Oscillator — The Bullish Divergence That Called the Bottom
SPY dropped from $653.18 to $631.97 over four sessions in late March — a 3.2% slide. But the McClellan Oscillator hit -120 on March 27 and only -95 on March 30 even as SPY printed a lower price close. That’s a textbook bullish divergence — the index making lower lows while breadth momentum makes higher lows. The selling was exhausting itself before the ceasefire catalyst even arrived. If you were watching the McClellan, you saw the bottom forming a full day before the index confirmed it.
VIX — Volatility Structure
The VIX closed at 19.23 on April 10, down from the upper 20s to low 30s during the peak of the March panic. The decline from ~30 to ~19 in under two weeks is a volatility crush, and that’s what fuels these kinds of explosive upside moves. When implied volatility collapses, short-volatility strategies pile in, options market makers delta-hedge by buying stock, and the mechanical bid lifts the entire tape. A VIX still above the long-term average of 17-18 means the market hasn’t fully de-risked — there’s still caution priced in — but the trajectory is constructive.
Put/Call Ratio — The Contrarian Signal
The SPY 30-day put/call ratio (open interest) stood at 2.42 as of April 6 — more than 2.4 puts for every call. That is extreme bearish positioning and a classic contrarian bullish signal. When everyone is already loaded up on protection, it means the fear is priced in. As the market rallied through April 8-10, those puts started expiring worthless or getting unwound, creating additional upward mechanical pressure through dealer hedging. The unwinding of extreme bearish positioning is one of the key fuel sources for this rally.
Sector Rotation — Where the Money Flowed
This is the story of the trade, and it’s beautiful when you understand the mechanics.
Before the rally (March): Energy (XLE) was the undisputed market leader, up 28.2% year-to-date as of mid-March. Every sub-sector of energy was up double digits — from 18% for E&P to 38% for refining & marketing. Energy was king because the Iran conflict was driving oil above $100.
The rotation on April 8 was violent. When the ceasefire hit, energy stocks that had surged since the start of the conflict got hammered. Exxon and Chevron both dropped more than 4%. Meanwhile, the S&P Industrials sector ripped 3.5% higher — its best day since April 2025. United Airlines surged 9.5%. Comfort Systems and GE Aerospace both rallied 7%. Carnival jumped 10% as Iran partially opened the Strait of Hormuz.
The money rotated OUT of: Energy, Defense, Commodities. The money rotated INTO: Technology (XLK), Industrials (XLI), Consumer Discretionary (XLY), Airlines, and Financials (XLF). Cyclicals outperformed defensives. The growth-value gap that had widened to 45% earlier this year is now starting to narrow. The S&P 500 Equal Weight Index gained 1.5% on Friday, outpacing the cap-weighted version — a bullish signal that the rally isn’t just Mag 7-driven. Participation is broadening.
Utilities (XLU) and Consumer Staples (XLP) — the defensive hidey-holes — are starting to lag. That’s exactly what you want to see in a healthy risk-on rotation.
The Magnificent 7 — The Money Is Coming Back
I’ve been watching this rotation develop, and I want to be clear: money is flowing back into the Mag 7. Here’s the evidence, stock by stock.
Going into this period, the Mag 7 were collectively down 10.5% in Q1 2026. The Roundhill Magnificent Seven ETF (MAGS) was down 11.6% year-to-date. Microsoft was the worst at -23.5%, Tesla at -17.4%. The group was beaten, battered, and left for dead by a market obsessed with energy and defense plays.
Then the ceasefire hit on April 8, and all seven participated. META led at +5%. TSLA, AMZN, and GOOGL posted gains north of 4%. NVDA and MSFT rallied 3.5%. Even AAPL, lagging its peers, gained 2.3%.
NVIDIA (NVDA) — $188.63 | The Technical Leader
NVDA issued a pivot bottom buy signal on March 30 and has since rallied 14.2%, notching eight consecutive days of gains with rising volume — a powerful technical signal. The stock bottomed around $165 in the March panic and closed Friday at $188.63, a move of over $23 from the low. The 3-month MACD has given a buy signal. The RSI sits at 47 — neutral, no overbought risk. Next resistance is $190.53, then the head-and-shoulders neckline at $197.72.
Why the move? At a forward P/E of 21x for a company growing earnings 74% year-over-year, the valuation disconnect was screaming. Nvidia posted fiscal 2026 revenue of $215.9 billion, up 65%. The oil price collapse directly benefits data center economics — lower energy costs for power-hungry AI infrastructure. And with hyperscalers committing $700 billion in 2026 capex, the spending goes directly through Nvidia. This is not speculation. This is following reported earnings and committed capital.
ALPHABET (GOOGL) — Best Mag 7 Performer YTD
Up 1.5% on the year, Alphabet is the relative strength leader of the group. It rallied 4%+ on the ceasefire day. Google’s Gemini AI model has eliminated the narrative that OpenAI was going to eat its lunch, and its tensor processing unit chips give it optionality as both an AI consumer and infrastructure provider.
META — Leading the Rally
Meta jumped 5% on April 8 — the single best Mag 7 performer on the ceasefire day. Ad revenue remains robust. The massive AI infrastructure buildout benefits directly from lower energy costs. The forward P/E is attractive relative to its growth rate, and institutional positioning had gotten too bearish.
AMAZON (AMZN) — From Laggard to Leader
AWS posted its fastest growth in years. Revenue grew 20% with 35% operating margins — the fastest clip in 13 quarters. Lower oil prices reduce shipping and logistics costs for the retail side. Amazon has been the Mag 7 laggard for seven consecutive years. That story may be changing.
MICROSOFT (MSFT) — Down 23% YTD, Highest Upside Torque
MSFT is the worst Mag 7 performer in 2026, down more than 23% year-to-date. Copilot adoption has been slower than expected. Executive departures added to the negative sentiment. But at these levels, any positive earnings surprise could generate a massive squeeze. Analyst consensus has it as a Strong Buy with 56.4% upside potential — the highest in the group. Intelligent Cloud grew 29% last quarter. The business is not broken; the stock just got caught in the crossfire.
TESLA (TSLA) — The Oil Beneficiary
The oil price collapse is directionally positive for EV adoption economics. Tesla rallied 4%+ on the ceasefire. Still down 17% YTD, but Elon Musk’s $1 billion in personal buying — the only net insider purchase across all seven Mag 7 names — tells you where the founder’s conviction sits.
APPLE (AAPL) — The Laggard
Apple participated with a 2.3% gain but lagged its peers. China manufacturing exposure and the tariff overhang continue to weigh. Revenue is expected to grow 9% in fiscal 2026 — the fastest since 2021 — but at 31x earnings, the market wants proof before it commits.
Why Money Is Rotating Back Into the Mag 7
The thesis is straightforward, and every piece connects:
1. The valuation reset is complete. The Mag 7 went from trading at 40x+ forward earnings to 29x projected profits. That compression created the opportunity.
2. Oil’s collapse changes the inflation math. A 16% single-day crude collapse breaks the inflationary pincer narrative. Lower oil means lower inflation expectations, which means the Fed can stay accommodative, which directly lifts long-duration growth stock valuations — i.e., the Mag 7.
3. AI capex is real and accelerating. $700 billion in committed 2026 technology capital expenditure. Nvidia at $215.9B revenue. AWS at $128.7B. Microsoft Intelligent Cloud up 29%. This is not a story about projections. This is following reported numbers and committed capital.
4. The earnings growth convergence creates relative value. Mag 7 earnings growth is expected at 18% in 2026 versus 13% for the other 493 S&P companies. The gap is narrowing, but 18% growth after a 10-11% drawdown means you’re getting premium growth at a discount.
5. Mechanical flows. With the VIX collapsing from 30 to 19 and the put/call ratio unwinding from 2.42, options market makers are forced to buy stock. The most liquid, most optioned names in the market are the Mag 7. The mechanical bid goes there first.
Intermarket Signals
Treasury Yields: The 10-year note dipped to 4.15%, easing pressure on valuations. Markets now price in a 65% probability of a 25-basis-point Fed cut at the June 2026 meeting, up from 55% earlier in the week. Falling yields are the Mag 7’s best friend.
Oil: WTI crashed from $110+ to $94.41 on the ceasefire. This single move rewires the entire inflation narrative and directly benefits every energy-consuming sector.
Dollar: A weakening dollar supports multinational earnings repatriation. About 28% of S&P 500 revenue comes from overseas. The weaker dollar trend is structural in 2026 and is why gold continues to work.
Gold at $4,787: Still elevated, still hedging. Gold’s strength alongside equities is the tell. Smart money is positioned for both outcomes. That’s not bearish — that’s professional risk management.
The Bottom Line, Can It Hold?
The rally from March 30 to April 12 is technically legitimate. The McClellan Oscillator flagged the bullish divergence at the bottom. The VIX is unwinding. The put/call ratio is normalizing from extremes. Sector rotation has shifted from defensive energy into risk-on technology, industrials, and consumer discretionary. The Mag 7 are absorbing serious capital flows, led by NVDA, META, and AMZN, with MSFT offering the highest upside torque for those willing to lean into the pain.
But this is not an all-clear. The 50-day breadth at 43% is the number I’m watching. If that crosses above 50% in the coming days, this rally has real legs and we’re looking at the start of a sustainable move higher. If it stalls here, we’re looking at a powerful tradeable bounce within a larger consolidation — not the beginning of a new upleg.
The ceasefire is two weeks, not a peace deal. The Fed can’t decide whether to cut or hike. Tariffs are a permanent cost. The Mag 7 represent 32.5% of the index — concentration risk has not gone away. Gold above $4,700 is confirming that the hedging community agrees.
Can It Hold? The bounce is real, I mentioned above what the sustainability is still in question until we receive conformation of stocks moving above the moving averages I mentioned. What could sustain this rally, in my view, is the absence of new surprises from the Gulf or the White House. It’s still not fully resolved, but markets are largely ignoring it for now. That likely changes once oil pushes back above $110 per barrel the narrative will shift to inflation deflation and rising rates. (although it is JUST A NARRATIVE the news organization run with it and causes doubt and uncertainty. As I’ve said before, the U.S. economy can handle $100+ oil—prices rise, but not dramatically. The real concern for markets, analysts, and portfolio managers comes when oil moves past $130- $150, it becomes a serious problem.
Until next time, Our Trade Desk
“Don’t dream what you want to do. Do what you dream. Living is about memories, not dreams. And there’s always room for another good memory.”
© 2026 Our Trade Desk | All Rights Reserved
DISCLAIMER
Our Trade Desk content is for informational and educational purposes only. I am not a registered investment advisor. Nothing on this show is personalized financial advice or a recommendation to buy or sell any security. I may hold positions in stocks we discuss, and those positions can change at any time without notice. Past performance is not indicative of future results. Investing involves substantial risk, including the loss of principal. Always do your own research and consult a licensed financial professional before making any investment decisions.”